Graph integers on horizontal and vertical number lines
Graph integers on horizontal and vertical number lines by Delta publications
key notes :
| Understanding Number Lines: |
- Horizontal Number Line: A straight line where numbers increase to the right and decrease to the left.

- Vertical Number Line: A straight line where numbers increase as you move up and decrease as you move down.

| Plotting Integers on a Horizontal Number Line: |
- Draw a horizontal line and mark the center point as 0.
- To the right of 0, mark positive integers at equal intervals (1, 2, 3, …).
- To the left of 0, mark negative integers at equal intervals (-1, -2, -3, …).

| Plotting Integers on a Vertical Number Line: |
- Draw a vertical line and mark the center point as 0.
- Above 0, mark positive integers at equal intervals (1, 2, 3, …).
- Below 0, mark negative integers at equal intervals (-1, -2, -3, …).

| Graphing a Single Integer: |
- Locate the integer on the number line.
- Draw a dot or a point at the corresponding position.


| Graphing Multiple Integers: |
- Repeat the process for each integer, ensuring each point is accurately placed.


| Using the Number Line for Comparison: |
- On a horizontal number line, integers to the right are greater.
- On a vertical number line, integers above are greater.
| Example Problems |
Graphing Integers on a Horizontal Number Line:

| Graphing Integers on a Vertical Number Line: |

| Practice Exercises |
Plot These Integers on a Horizontal Number Line:
-5, -2, 0, 1, 4
Plot These Integers on a Vertical Number Line:
3, 0, -1, -3
Answer the Questions:
- Which is farther from 0:
-6or5? - On a thermometer, if the temperature changes from
-2°Cto3°C, how many degrees did it rise?
Learn with an example
🔥Graph 5 and –5 on the number line.
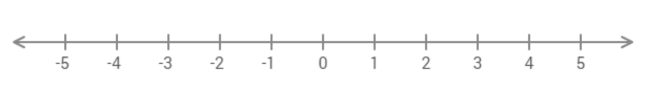
- Find 5 and –5 on the number line. 5 is positive, so it is to the right of 0. –5 is negative, so it is to the left of 0.Graph the points.

- Notice that 5 and –5 are the same distance from 0. This means they are opposite numbers.
🗼 Graph –3 and –5 on the number line

- Find -3 and -5 on the number line. -3 and -5 are negative, so they are to the left of 0.
- Graph the points

Try some practice problems!

