Rate of change
Key notes:
🔹 What is Rate of Change?
👉 The rate of change tells us how much one quantity changes compared to another.
👉 It shows how fast something is increasing or decreasing ⏱️
🔹 Simple Meaning
📊 Rate of Change = Change in one value ÷ Change in another value
🧮 Example:
If a car travels 100 km in 2 hours 🚗
➡️ Rate of change = 100 ÷ 2 = 50 km per hour
🔹 Where Do We See Rate of Change? 👀
✅ Speed (distance per time) 🚴
✅ Money earned per day 💰
✅ Growth of plants per week 🌱
✅ Temperature change per hour 🌡️
🔹 Positive & Negative Rate of Change
➕ Positive ➜ value increases 📈
➖ Negative ➜ value decreases 📉
🧮 Example:
📈 Saving money every day = Positive
📉 Losing money every day = Negative
🔹 Rate of Change in Tables 📋
👉 Find how much the values go up or down each step
👉 Divide the change in output by the change in input
🔹 Rate of Change in Graphs 📉📊
👉 Shown by the steepness of the line
🔺 Steep line = Faster change
🔻 Flat line = No change
🔹 Units Matter! ⚠️
📏 Always write units (km/h, ₹/day, °C/hour)
➡️ Units help us understand the rate clearly
🔹 Real-Life Example 🌍
🚌 A bus fare increases ₹5 every year
➡️ Rate of change = ₹5 per year
✨ Quick Tip
🧠 Rate of change helps us compare how things grow, move, or change over time!
Learn with an example
✒️ A dog show enthusiast recorded the weight of the winning dog at recent dog shows.
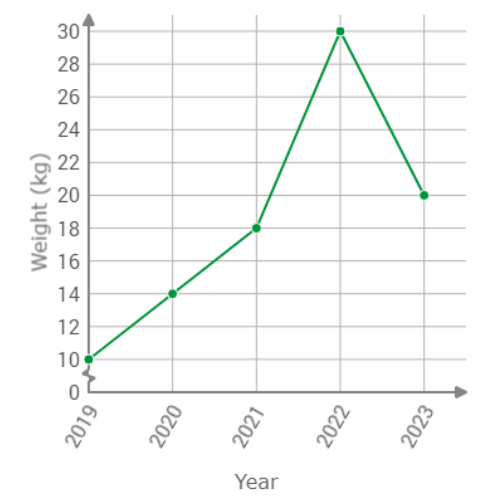
According to the graph, what was the rate of change between 2021 and 2022?
_______ kilograms per year
Plug the numbers into the formula for rate of change and simplify.
Rate of change = change in value / change in time
= 30 kilograms – 18 kilograms / 2022 – 2021
= 30 kilograms – 18 kilograms / 1 year
= 12 kilograms / 1 year
= 12 kilograms per year
The rate of change between 2021 and 2022 was 12 kilograms per year.
✒️ A restaurant’s average food preparation time was tracked from day to day as part of an efficiency improvement programme.
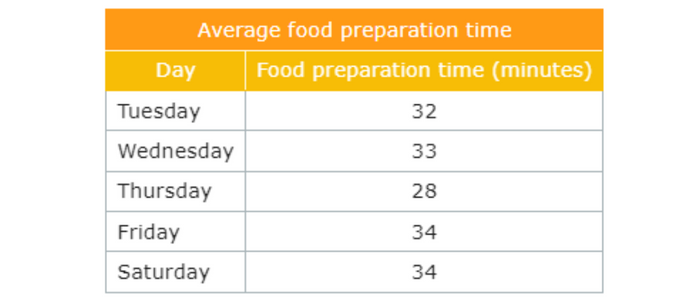
According to the table, what was the rate of change between Thursday and Friday?
_____ minutes per day
Plug the numbers into the formula for rate of change and simplify.
Rate of change = change in value / change in time
= 34 minutes – 28 minutes / 1 day
= 6 minutes / 1 day
= 6 minutes per day
The rate of change between Thursday and Friday was 6minutes per day.
✒️ A restaurant’s average food preparation time was tracked from day to day as part of an efficiency improvement programme.
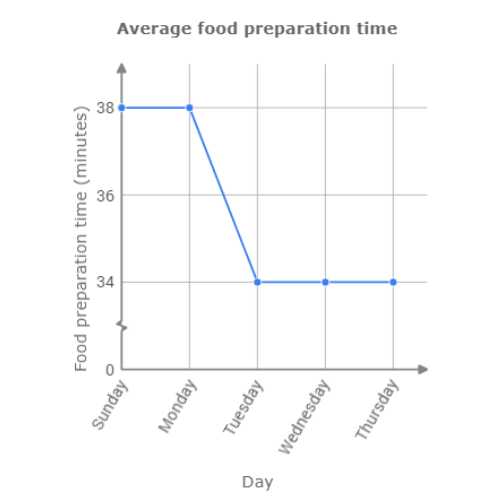
According to the graph, what was the rate of change between Monday and Tuesday?
_____ minutes per day
Plug the numbers into the formula for rate of change and simplify.
Rate of change = change in value / change in time
= 34 minutes – 38 minutes / 1 day
= -4 minutes
= -4 minutes per day
The rate of change between Monday and Tuesday was
let’s practice! 🖊️