Interpret tables
Key notes !
1. Understanding Tables
- Tables organize data into rows and columns to present information clearly.
- Each row typically represents a category or group, and each column represents a variable or attribute.
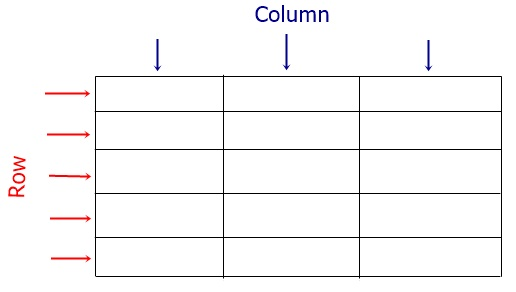
2. Components of a Table
- Title: Describes the purpose or content of the table.
- Rows: List the different categories or items being measured.
- Columns: Show the variables or measurements related to each category.
- Frequency: Indicates how often a particular value or event occurs.
3. Steps to Interpret a Table
- Identify the Title: Understand the context of the data presented.
- Read the Column Headings: Determine what each column represents (e.g., frequency, number of items).
- Examine the Data: Look at the values in the table to identify patterns or key information.
- Answer Specific Questions: Use the data to respond to questions, such as finding the highest or lowest value or calculating totals.
4. Practical Application Examples
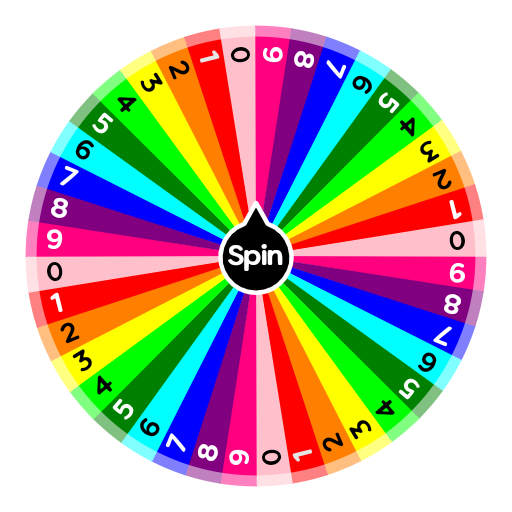
- Frequency Tables: Used to show how often different events or values occur. For example, in a game show, how often a wheel stops on a particular number.
- Problem-Solving: Tables can help answer questions like “Which number was spun the most?” or “How many students made more than a certain number of items?”
5. Interpreting Frequency Tables
- Highest Frequency: Identify the row with the highest frequency to determine the most common event or value.
- Cumulative Frequency: Add frequencies across several rows to answer questions about cumulative occurrences (e.g., total students who made more than 2 picture frames).
Learn with an example
▶️ A game show viewer monitors how often a wheel numbered 1 through 5 stops at each number.
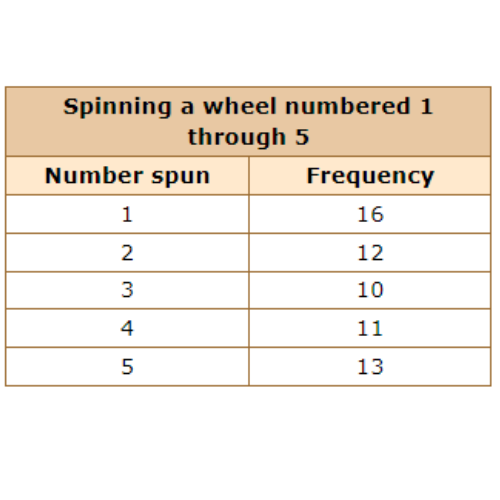
Which number was spun the most times?
Look at the frequency column. Find the greatest frequency. The greatest frequency is 16, which is in the row for 1. 1 was spun the most times.
▶️ The shop teacher, Mr. Cameron, wrote down how many picture frames the students made last week.
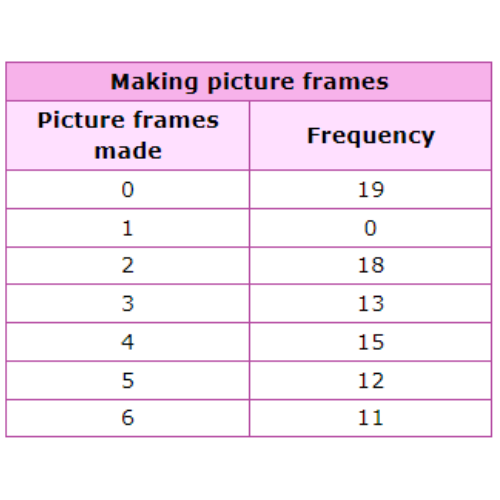
How many students made more than 2 picture frames?
Find the rows for 3, 4, 5, and 6 picture frames. Add the frequencies for these rows.
Add:
13 + 15 + 12 + 11 = 51
51 students made more than 2 picture frames.
▶️ For Earth Day, Morristown High’s environmental club tracked the number of seeds planted by its members.
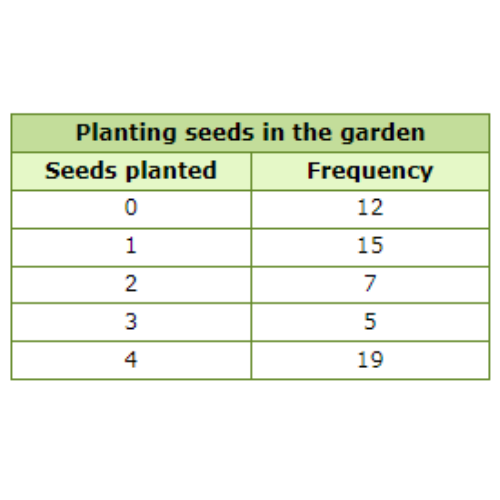
How many members planted fewer than 2 seeds?
Find the rows for 0 and 1 seed. Add the frequencies for these rows.
Add:
12 + 15 = 27
27 members planted fewer than 2 seeds.
Let’s practice!🖊️