Interpret stem-and-leaf plots
key notes :
1. Understanding a Stem-and-Leaf Plot
- Stem-and-Leaf Plot: A way to organize and display numerical data where each number is split into a “stem” (the leading digit(s)) and a “leaf” (the last digit).
- Purpose: To quickly show the distribution of data and identify patterns like the median, mode, range, and outliers.

2. Components of a Stem-and-Leaf Plot
- Stem: Represents the leading digit(s) of each number. For example, in the number 47, the stem would be 4.
- Leaf: Represents the last digit of each number. In the number 47, the leaf would be 7.
- Key: A key is usually provided to explain how to read the plot. For example, “4 | 7 means 47.”
3. Steps to Interpret a Stem-and-Leaf Plot
- Step 1: Read the Key
- Start by understanding the key to know how to read the stems and leaves.
- Step 2: Identify the Data Points
- Combine the stem and leaf to form the original numbers. For example, if the stem is 5 and the leaf is 3, the number is 53.
- Step 3: Analyze the Distribution
- Range: Find the difference between the highest and lowest values by looking at the first and last numbers.
- Median: Locate the middle value by counting from both ends of the list.
- Mode: Identify the most frequent data point by observing which leaf appears most often.
- Clusters and Gaps: Notice any clusters of data (where many numbers are close together) and gaps (where few or no numbers appear).
4. Example of a Stem-and-Leaf Plot
- Data Set: 32, 34, 36, 41, 42, 43, 45, 47, 52, 53, 53, 54, 61.
- Stem-and-Leaf Plot

- Key: 3 | 2 means 32.
5. Analyzing the Example Plot
- Range: The range is 61 – 32 = 29.
- Median: The middle value is the 7th number (45).
- Mode: The number 53 appears most often.
- Clusters: There’s a cluster around 40-50.
- Gaps: There is a gap between the leaf values from 6 to 1 in the stems 3 and 4.
6. Benefits of Stem-and-Leaf Plots
- Detailed View: Shows individual data points while also providing a visual distribution.
- Quick Analysis: Allows for rapid identification of key statistical concepts like median and mode.
- Comparison: Makes it easier to compare different sets of data, especially in finding where data clusters.
7. Common Mistakes to Avoid
- Misinterpreting the Key: Always read the key correctly to avoid confusion between stems and leaves.
- Forgetting to Order the Leaves: Leaves should be listed in ascending order for clarity.
- Overlooking the Range and Gaps: Always check the full spread of data and note any significant gaps.
8. Practical Tips
- Practice reading different stem-and-leaf plots to get comfortable with the format.
- Pay attention to the shape of the distribution, as it can indicate the nature of the data set.
- Use stem-and-leaf plots to double-check calculations like median or mode.
Learn with an example
🌀 Jen counted the number of pieces of pepperoni on each pizza she made.
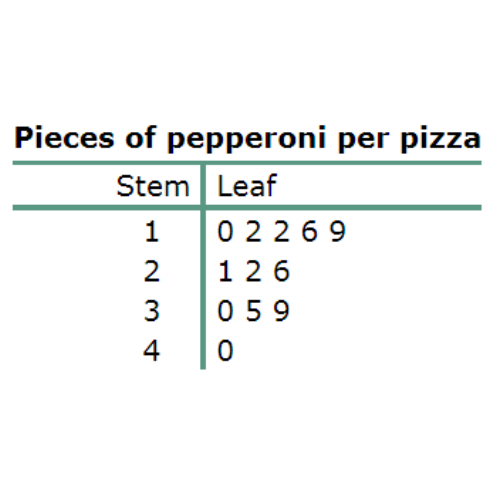
How many pizzas had fewer than 40 pieces of pepperoni?
_______ pizzas
Count all the leaves in the rows with stems 1, 2, and 3.
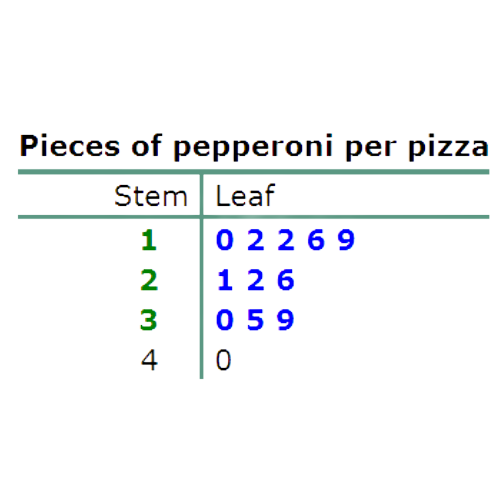
You counted 11 leaves, which are blue in the stem-and-leaf plot above. 11 pizzas had fewer than 40 pieces of pepperoni.
🌀 Jada counted the pages in each book on her English class’s required reading list.
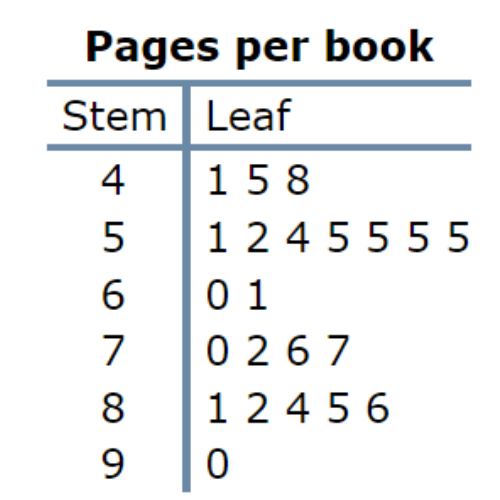
How many books had exactly 55 pages?
________ books
For the number 55, the stem is 5, and the leaf is 5. Find the row where the stem is 5. In that row, count all the leaves equal to 5.
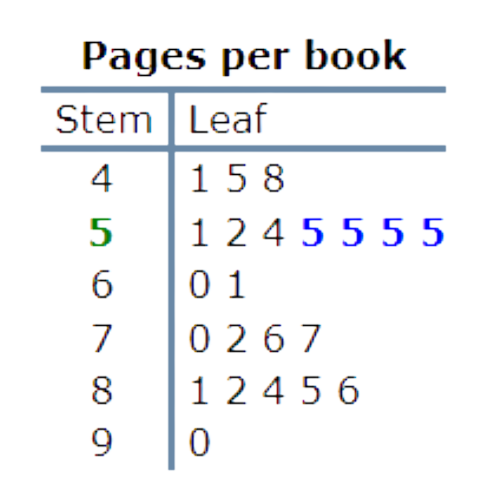
You counted 4 leaves, which are blue in the stem-and-leaf plot above. 4 books had exactly 55 pages.
🌀 A volunteer for the local running club counted the number of participants at each race.
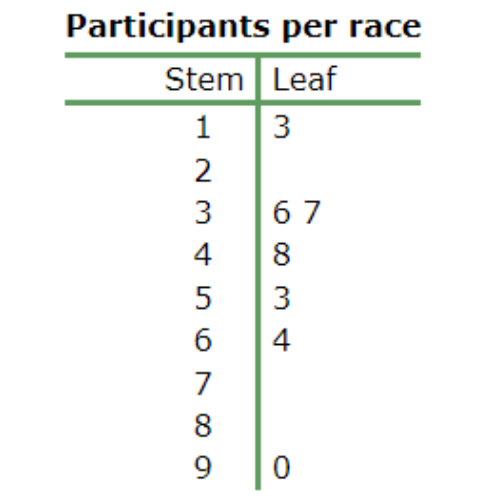
How many races had at least 20 participants but fewer than 60 participants?
_____ races
Count all the leaves in the rows with stems 2, 3, 4, and 5.
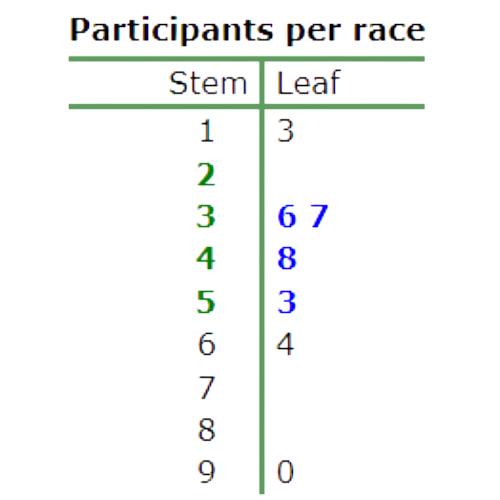
You counted 4 leaves, which are blue in the stem-and-leaf plot above. 4 races had at least 20 participants but fewer than 60 participants.
Let’s practice!🖊️