Create stem-and-leaf plots
key notes :
1. What is a Stem-and-Leaf Plot?
- A stem-and-leaf plot is a way to organize numerical data in a visual format where each number is split into two parts: the stem (all but the last digit) and the leaf (the last digit).
- Purpose: It helps in displaying data in a way that shows both the distribution and the exact values of the data points.

2. Components of a Stem-and-Leaf Plot
- Stem: Represents the leading digits of each number.
- Leaf: Represents the last digit of each number.
- Key: A legend that explains how to read the plot. For example, “4 | 7 = 47” means the stem is 4 and the leaf is 7, forming the number 47.
3. Steps to Create a Stem-and-Leaf Plot
- Step 1: Organize the Data
- Start by listing all the data points in ascending order. This makes it easier to place them correctly in the plot.
- Step 2: Determine the Stems
- Identify the leading digits (stem) of each number.
- For example, if the numbers are 32, 34, and 36, the stem is 3.
- Step 3: List the Stems
- Write down all possible stems in a vertical column from smallest to largest.
- Even if a stem has no leaves (e.g., if no data falls into the 20s), you should still list it for completeness.
- Step 4: Add the Leaves
- For each number, write the last digit (leaf) next to its corresponding stem.
- Example: For the numbers 32, 34, and 36, the plot will have

- Step 5: Organize the Leaves
- List the leaves in ascending order next to each stem for clarity.
- This helps in quickly identifying the distribution of data.
- Step 6: Include a Key
- Always include a key that explains how to interpret the plot. For example: “3 | 2 = 32”.
4. Example of a Stem-and-Leaf Plot
- Data Set: 42, 44, 46, 53, 55, 57, 61, 63, 65, 67.
- Stem-and-Leaf Plot:

- Key: 4 | 2 = 42.
5. Analyzing Your Stem-and-Leaf Plot
- Distribution: Examine the distribution of the data by looking at how the leaves are spread out.
- Clusters and Gaps: Identify clusters where data points are close together and gaps where few or no data points exist.
- Outliers: Notice if there are any outliers—data points that stand far from the rest of the values.
6. Benefits of Using Stem-and-Leaf Plots
- Detailed View: Unlike other types of graphs, stem-and-leaf plots show all individual data points.
- Quick Analysis: It’s easy to find the mode, median, range, and distribution patterns directly from the plot.
- Comparison: Helpful in comparing different sets of data visually.
7. Common Mistakes to Avoid
- Incorrect Stems: Ensure that stems correctly represent the leading digits of the numbers.
- Missing or Extra Leaves: Double-check that each leaf corresponds to the correct stem and that no leaves are omitted or duplicated.
- Unsorted Leaves: Leaves should always be in ascending order for clarity.
- Forgetting the Key: Always include a key to ensure that the plot can be interpreted correctly.
8. Practical Tips
- Practice with small data sets to build confidence before moving on to larger sets.
- Use different color markers for stems and leaves to make the plot easier to read.
- Always verify your plot by adding the stems and leaves to make sure they match the original data set.
Learn with an example
🌀 A researcher recorded the number of cows on each farm in the county.
Cows per farm
33 40 42 42 45 48 48 49 50 51 52 57 57 57 62 65 73 77 80 86 88
Use the data to complete the stem-and-leaf plot.
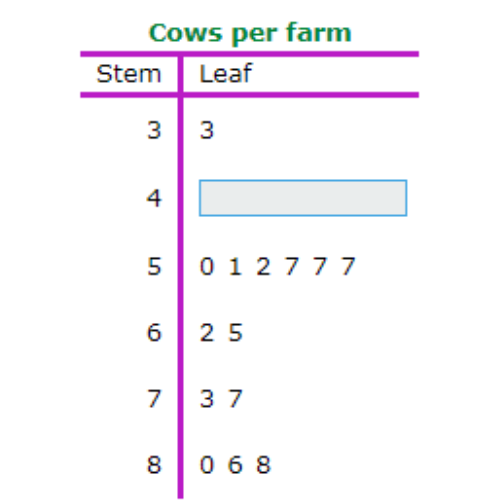
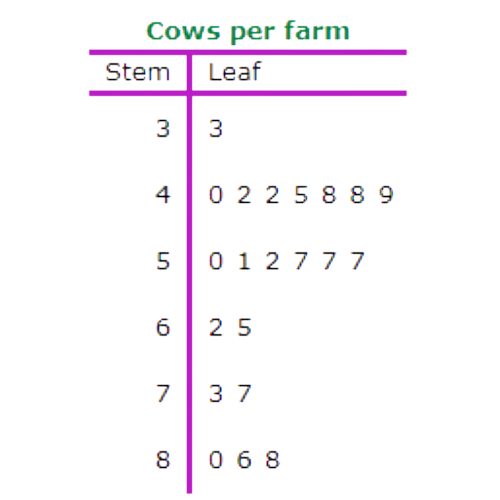
The stem in the missing row is 4.
Write the leaves 0, 2, 2, 5, 8, 8, and 9 in this row to represent the numbers 40, 42, 42, 45, 48, 48, and 49.
🌀 Ollie’s P.E. class participated in a press-up competition, and Ollie wrote down how many press-ups each person could do.
Press-ups
12 20 22 34 40 49 55 56 63 64 68 76 85 88 89 94 94
Use the data to complete the stem-and-leaf plot.
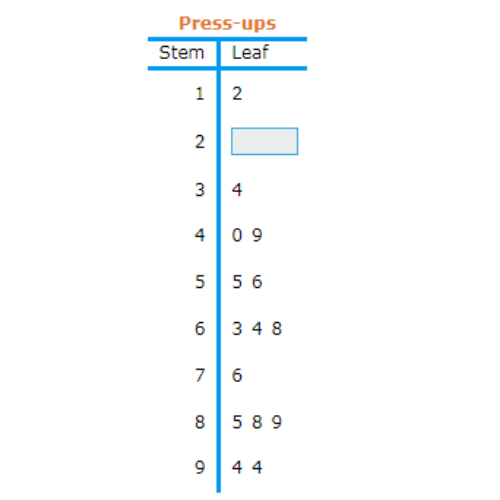
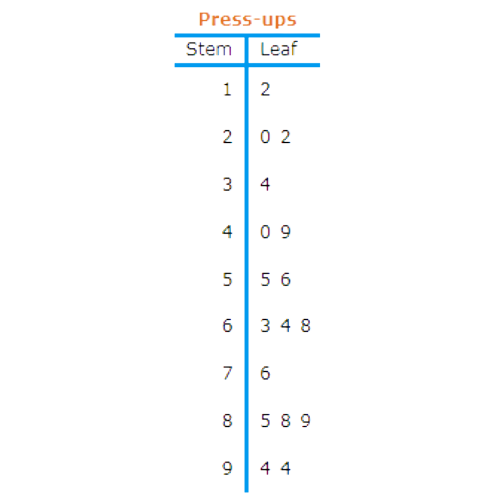
The stem in the missing row is 2.
Write the leaves 0 and 2 in this row to represent the numbers 20 and 22.
🌀 Isabelle counted all the beads in each necklace at the jewellery store where she works.
Beads per necklace
43 45 48 55 56 58 62 63 63 67 71 72 74 77 78 78 81 86 88 92 93 94 94 97
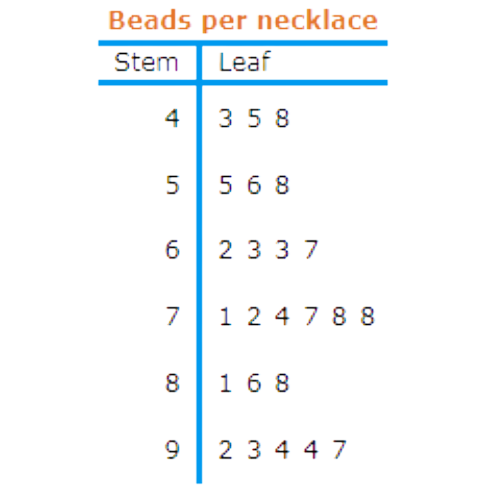
Use the data to complete the stem-and-leaf plot.
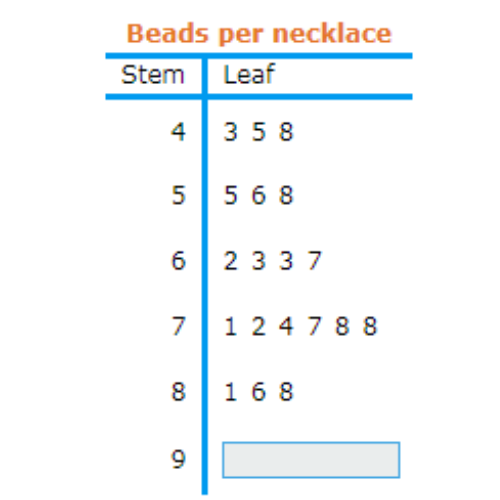
The stem in the missing row is 9.
Write the leaves 2, 3, 4, 4, and 7 in this row to represent the numbers 92, 93, 94, 94, and 97.
Let’s practice!🖊️