Create histograms
key notes !
1. What is a Histogram?
- A histogram is a graphical representation of data that shows the distribution of a dataset by dividing it into intervals (bins) and displaying the frequency of data points in each bin.
- Unlike bar graphs, histograms are used for continuous data, and the bars touch each other.
2. Parts of a Histogram
- Title: Describes what the histogram represents.
- X-axis (Horizontal axis): Represents the intervals (bins) of data, showing ranges of values.
- Y-axis (Vertical axis): Represents the frequency or count of data points within each interval.
- Bars: Each bar represents the frequency of data within the interval it corresponds to. The height of the bar shows how many data points fall into that interval.
3. Steps to Create a Histogram
- Step 1: Collect Data: Gather the data that you want to represent in a histogram.
- Step 2: Organize Data: Arrange the data in ascending order and identify the range (the difference between the maximum and minimum values).
- Step 3: Choose Intervals (Bins):
- Divide the range into equal intervals (bins). The number of bins can vary depending on the data and desired detail level, but typically 5-10 bins are used.
- Step 4: Count Frequencies:
- Count how many data points fall into each bin. This count will be the frequency for each interval.
- Step 5: Draw the X-axis and Y-axis:
- Label the X-axis with the intervals and the Y-axis with the frequency values.
- Step 6: Draw Bars:
- For each interval, draw a bar that reaches up to the corresponding frequency on the Y-axis. Make sure the bars touch each other to show the continuous nature of the data.
- Step 7: Add a Title:
- Give your histogram a title that clearly explains what the data represents.
4. Choosing the Right Bin Size
- The bin size can greatly affect the appearance of the histogram.
- Too Few Bins: The histogram may be too generalized, losing detail in the data distribution.
- Too Many Bins: The histogram may become too detailed, making it difficult to identify trends or patterns.
- Aim for a bin size that balances detail and clarity.
5. Common Mistakes to Avoid
- Incorrect Bin Sizes: Ensure that intervals are evenly spaced and cover the entire range of data without overlapping.
- Mislabeling the Axes: Always label both axes correctly to avoid confusion when interpreting the histogram.
- Gaps Between Bars: Remember, in histograms, bars should touch each other since the data is continuous.
6. Interpreting the Histogram After Creating It
- Identify the Mode: The interval with the highest bar is where most data points are concentrated.
- Analyze the Spread: Observe how widely the data is distributed across the intervals.
- Look for Skewness: Determine if the data is skewed to the left, right, or is symmetrical.
7. Applications of Histograms
- Histograms are commonly used in statistics to visualize the distribution of a dataset, such as test scores, heights, or temperatures.
- They help in understanding the shape, central tendency, and spread of the data.
Learn with an example
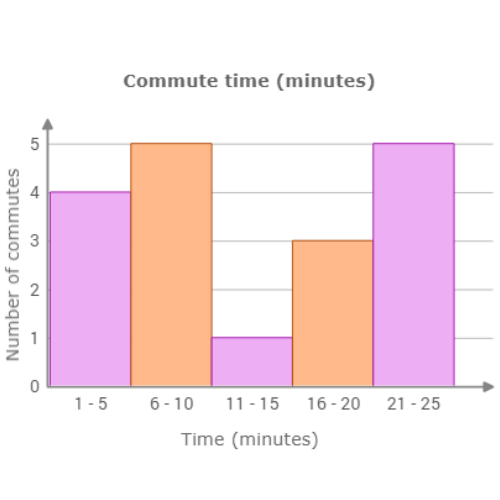
🔔 A business magazine surveyed its readers about their commute times.
Use the data to complete the histogram below.
Commute time (minutes)
2 3 3 4 7 9 9 9 10 13 16 17 20 23 23 23 25 25
Click to set the height of the missing bar.
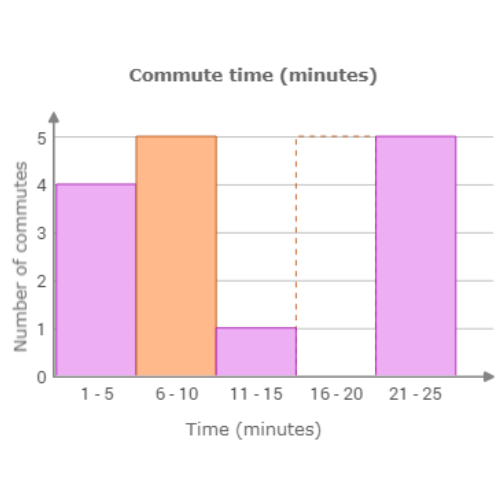
The missing bar is for the range 16 – 20 minutes. Count the number of values in this range. 3 commutes are between 16 and 20 minutes. Set the height of the bar to 3.
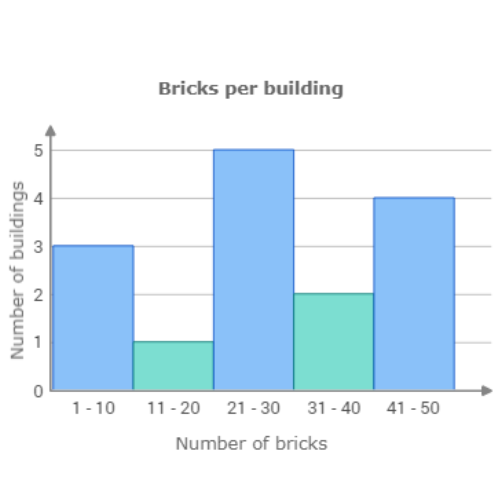
🔔 The architecture student counted the number of bricks in each building in his neighbourhood.
Use the data to complete the histogram below.
Bricks per building
32 23 32 8 6 43 49 4 20 21 43 26 21 46 21
Click to set the height of the missing bar.
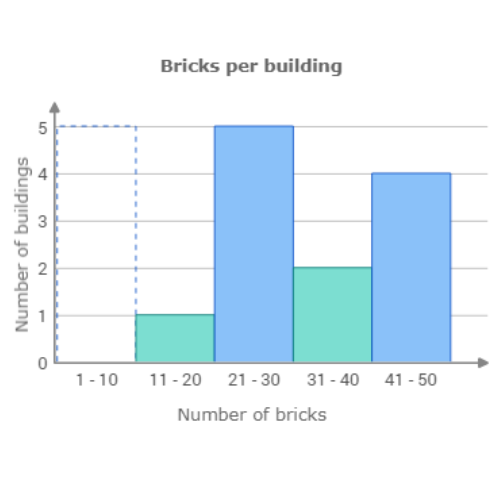
The missing bar is for the range 1 – 10 bricks. Count the number of values in this range. 3 buildings have between 1 and 10 bricks. Set the height of the bar to 3.
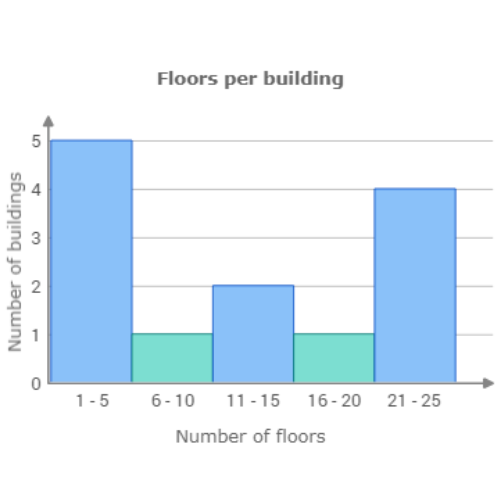
🔔 A city planner counted the number of floors per building in the downtown area.
Use the data to complete the histogram below.
Floors per building
5 22 6 22 4 3 20 13 15 5 23 22 2
Click to set the height of the missing bar.
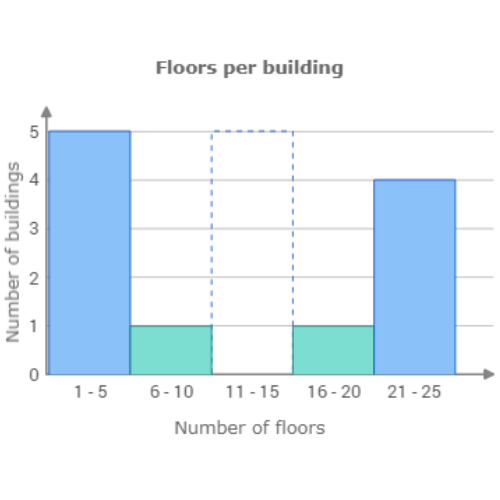
The missing bar is for the range 11 – 15 floors. Count the number of values in this range. 2 buildings have between 11 and 15 floors. Set the height of the bar to 2.
Let’s practice!🖊️